
Market Review 2022: After a Down Year, Looking to the Past as a Guide
Posted on 3rd February 2023
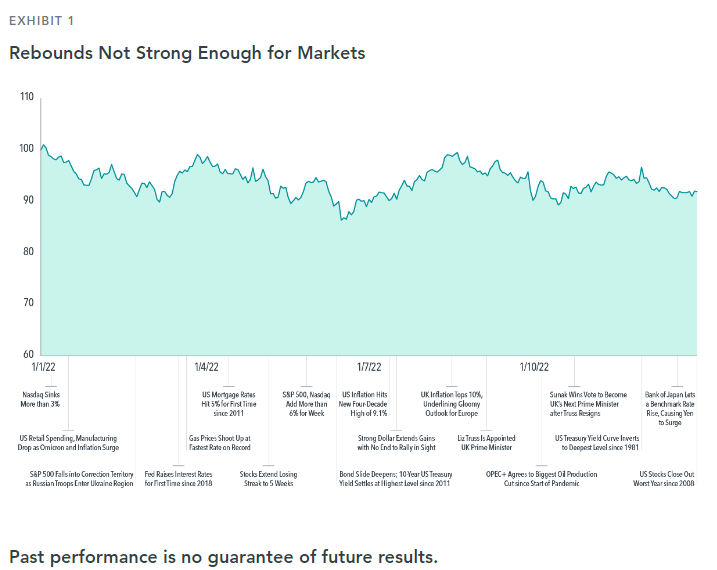
It was an up-and-down year for markets—in the end, one with more down than up. The world gave financial markets a lot to process.
The coronavirus pandemic eased but remained a global concern, as did the supply-chain issues that accompanied its arrival. Inflation reached a 40-year high in the US,1 and the Federal Reserve pursued a series of rate increases to combat rising prices, actions similar to those taken by other nations’ central banks. Russia’s invasion of Ukraine in February brought uncertainty about political stability and energy prices, among other worries. A midterm US election shifted more power to Republicans but left Democrats in a stronger position than some had expected. Against this backdrop, equity and bond markets fell for the year, despite several rallies.
Inflation was front and center all year long. In the UK, annual inflation reached more than 10% in 2022, the highest recording in decades. Similarly, consumers in the US experienced the highest price increases in four decades,2 and the Fed lifted rates in a bid to reduce inflation from above 9% to the long-term target of 2%. Price increases showed signs of peaking late in the year, with inflation easing to 7.1% in the US in November, although a slow retreat from multidecade highs could keep it a concern for central banks well into 2023. Supply chain issues related to the pandemic and to Russia’s war in Ukraine also eased, and food and fuel costs declined.
In local currency terms, the S&P 500 Index3 fell to a two-year low in September; at one point, the index had given back 50% of its post-pandemic rally. After the sharp drop in the first half of the year, led by technology stocks, the stock market rebounded somewhat. That came as the political situation became clearer and with investors pricing in prospects of smaller Fed rate hikes going forward as inflation cooled. Despite the rally, the S&P 500 fell 18.1% for the year in local currency terms, its worst annual return since the financial crisis in 2008. However, the appreciation of the US dollar against the pound sterling benefited unhedged pound sterling investors. In GBP terms, the S&P 500 fell by 7.8%.
Global equities, as measured by the MSCI All Country World Index,4 fell 8.1% in GBP terms (see Exhibit 1). The MSCI United Kingdom Index returned 7.1%. Developed international stocks, as represented by the MSCI World ex UK Index, lost 8.4%, while emerging markets declined even further, with the MSCI Emerging Markets Index down 10.0%.
While markets were down as a whole, value stocks were a bright spot for investors. Value shares have prices that are low relative to a measure like a company’s book value, and these stocks outperformed pricier growth stocks by the largest margin since 2000, at the end of the initial dot-com craze: In GBP terms, the MSCI All Country World Value Index gained 4.1% vs. a 19.6% decline for the MSCI All Country World Growth Index. That recent turnaround has rewarded investors who remained disciplined following a three-year slump for value, which ended in June 2020. Since then, value has beaten growth by 10.2 percentage points, annualised. Small capitalisation stocks held their own with large cap stocks. In GBP terms, the MSCI All Country World Small Cap Index declined 8.4% vs. the 8.1% fall for the MSCI All Country World Index. Historically, small cap stocks have outperformed large cap stocks.5
Silver Linings for Battered Bonds
Some may view fixed income as a safe haven for investors, expecting bonds to rise in value when stocks fall. However, this was not the case in 2022. The tandem decline for equities and fixed income was relatively rare. GBP-denominated bonds experienced their highest volatility and worst return in decades losing 23.2%, whereas USD-denominated bonds lost 13.0% in local currency terms, a second straight annual loss.6 The last time investors saw back-to-back losses was in the late 1950s. The US yield curve, which charts the difference in yield between long-dated and short-dated bonds, was inverted at year’s end. The 10-year yield ended just below 3.9%, while the 2-year yield was just above 4.4%,7 reflecting the higher short-term rates.
Higher interest rates can bring short term pain as bond prices fall, but they can be beneficial in the long term and present new opportunities for fixed income investors. Some investors may be hesitant to take advantage of higher yields, perhaps because of concerns about the potential for even higher yields to come. They may even consider reducing their bond exposure. But if yields keep rising, investors seeking higher expected returns may still be better off maintaining the duration of their fixed income allocation. Rising yields affect fixed income portfolios in several ways. Longer-duration portfolios may experience larger immediate declines in value relative to shorter-duration portfolios as yields increase. But higher yields may lead to higher expected returns. Similarly, investors who have seen equity prices fall may be tempted to sell. But lower stock prices can be indicative of higher expected returns.8
A Reset for Crypto and FAANG Stocks
If the market decline of 2022 taught investors anything, it’s that what goes up might also come down. Some of the most hyped investments of the past two years did just that. Cryptocurrencies9 and FAANG stocks10 were all hit hard, with bitcoin falling below $17,000, about 75% lower than its high of nearly $68,000 in November 2021.11 As investors have learned by now, cryptocurrencies can be extremely volatile. From a distance, bitcoin might appear to have enjoyed a steady climb through much of its existence. There were, however, major slumps: On three occasions since 2017, bitcoin has fallen by more than 50%, including the decline that extended into 2022.
The FAANGs also saw notable declines in 2022 (see Exhibit 2). The group of tech stocks lost a combined $3.2 trillion in market value—one might say the market was de-FAANGed. Facebook parent Meta Platforms, Amazon, Apple, Netflix, and Google parent Alphabet all lagged the broad US market, with Facebook and Netflix suffering particularly sharp losses. In local currency terms, the group collectively underperformed the Russell 3000 Index12 by more than 20 percentage points.13 The slump came on the heels of a stellar decade—the FAANGs returned 28% per year from 2012 to 2021.
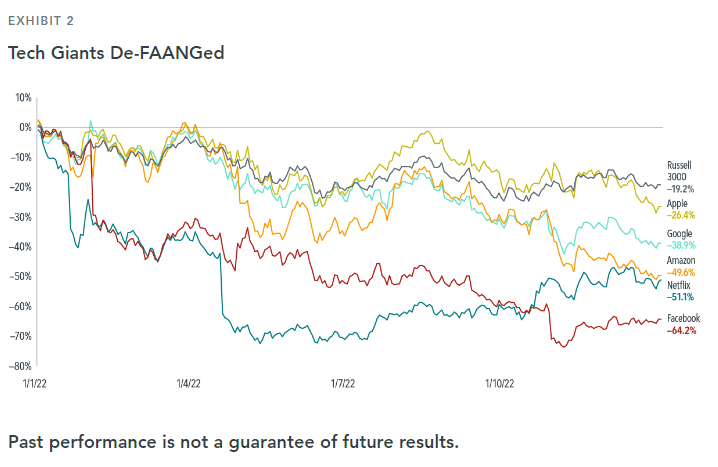
That reversal is a reminder that investors should be cautious about assuming past returns will continue. Even if a company with a track record of strong stock returns remains broadly successful, that may not translate to spectacular future returns. Excellence may now be what investors are counting on and not the basis for above-market returns. This point is borne out by looking back at stocks as they grew to become among the Top 10 largest by market cap. On average, their performance lagged the performance of the broader market within a few years of entering the Top 10.
Taking a Balanced View of the 60/40 Portfolio
With both fixed income and equities declining on the year, the traditional 60% stock/40% bond portfolio had a hard time offering much support in either asset category, leading some to question the utility of this approach. The US market can give us a helpful perspective on this question as it offers the longest continuous data set. Although 2022 was the worst year in history for many bond indices, the performance of the 60/40 portfolio14 didn’t crack the top five peak-to-trough drawdowns in close to a century’s worth of data. The drawdown that reached 19% at its nadir was painful, but it’s only two-thirds of the 30% peak-to-trough drawdown15 investors endured through a particularly difficult period from 2007–2009. And the portfolio saw some recovery late in the year, ending down 11% for 2022.
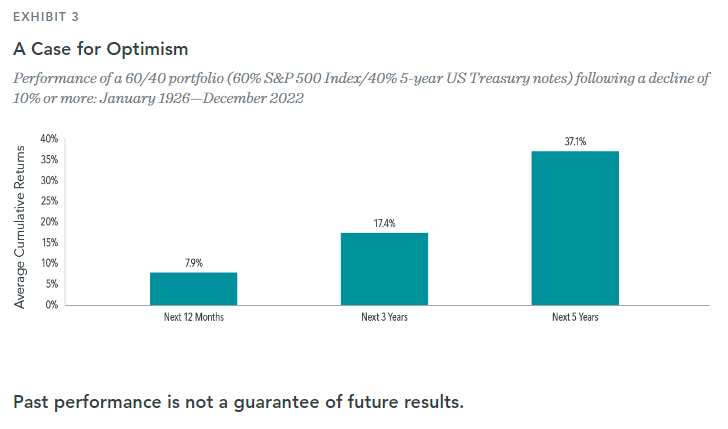
During rocky markets, it is especially important for investors to focus not solely on where returns have been but also on where they could be going. Looking at the performance of a 60/40 portfolio following a decline of 10% or more since 1926, returns on average have been strong in the subsequent one-, three-, and five-year periods (see Exhibit 3).
Sticking with a Plan
There’s no way to know where markets may be headed, and it can be hard to imagine an upturn when prices have fallen or when there is consternation about the direction of the economy. But history argues for persistence and patience. With the yield curve inverted, some economists are saying a recession is inevitable, if one hasn’t already begun. But history shows that across the two years that follow a recession’s onset, equities have a track record of positive performance, on average. This is an important lesson on the forward-looking nature of markets, highlighting how current prices reflect market participants’ collective expectations for the future. Likewise, US equity returns following sharp declines have, on average, been positive over one-year, three-year, and five-year periods.
A look back at recent history makes a case for sticking with a plan. Handsome rebounds after steep declines can help put investors in position to capture the long-term benefits the markets offer. Those who sold their stockholdings during the dot-com crash in the early 2000s wouldn’t have been in position to enjoy the equity recovery that eventually followed. Similarly, those abandoning a plan early in the 2008-09 financial crisis, or in March of 2020 as COVID fears spread, wouldn’t have benefited from the subsequent rallies. As we look at prices that in some cases are well off their highs, it’s helpful to keep history in mind entering 2023. That’s the definition of thinking of investing for the long term.
Share this post: